


Last week, investors were spooked by geopolitical tensions and expectations of interest rates remaining higher for longer. The fear sent investors selling equities, resulting in the broader indexes breaking below their upward trendlines. This week, the market looked like it could be bouncing, and many investors wondered if it would bounce back.
So is this a good time to pick up some stocks? It may seem tempting, but the market looks indecisive. At such times, it’s best to tread with caution.
This week is a big earnings week, with big tech companies reporting; if these are weak, they could hurt the stock market. We saw this unfold when Meta Platforms (META) reported earnings on Wednesday after the close. Even though META’s earnings and revenues beat expectations, the stock price dropped like a rock on disappointing Q2 guidance. This spilled into other stocks, and the major indexes continued their downward fall.
Another data point dampening investor optimism was the Q1 GDP, which was well below economic forecasts. The broader indexes were all lower and approaching Friday’s close. But the market bounced back, and positive earnings reports from Microsoft (MSFT) and Alphabet (GOOGL) added a dose of optimism. A key area to watch is where the indexes will close relative to last week. A positive sign would be if they stay above Friday’s close.
What does all of this mean for the market, going forward?
The Pullback Play in SPY
View the live chart.

Let’s take a closer look at the daily chart of SPDR S&P 500 ETF (SPY). The ETF has been trading above its 50-day simple moving average (SMA) since November 2023 and has been moving in a pretty steady uptrend (red dashed line) until early April 2024, when its value fell below the trendline. Since the breakdown, SPY has been trading in a downward channel. This week’s bounce took it to the top end of the downward channel.
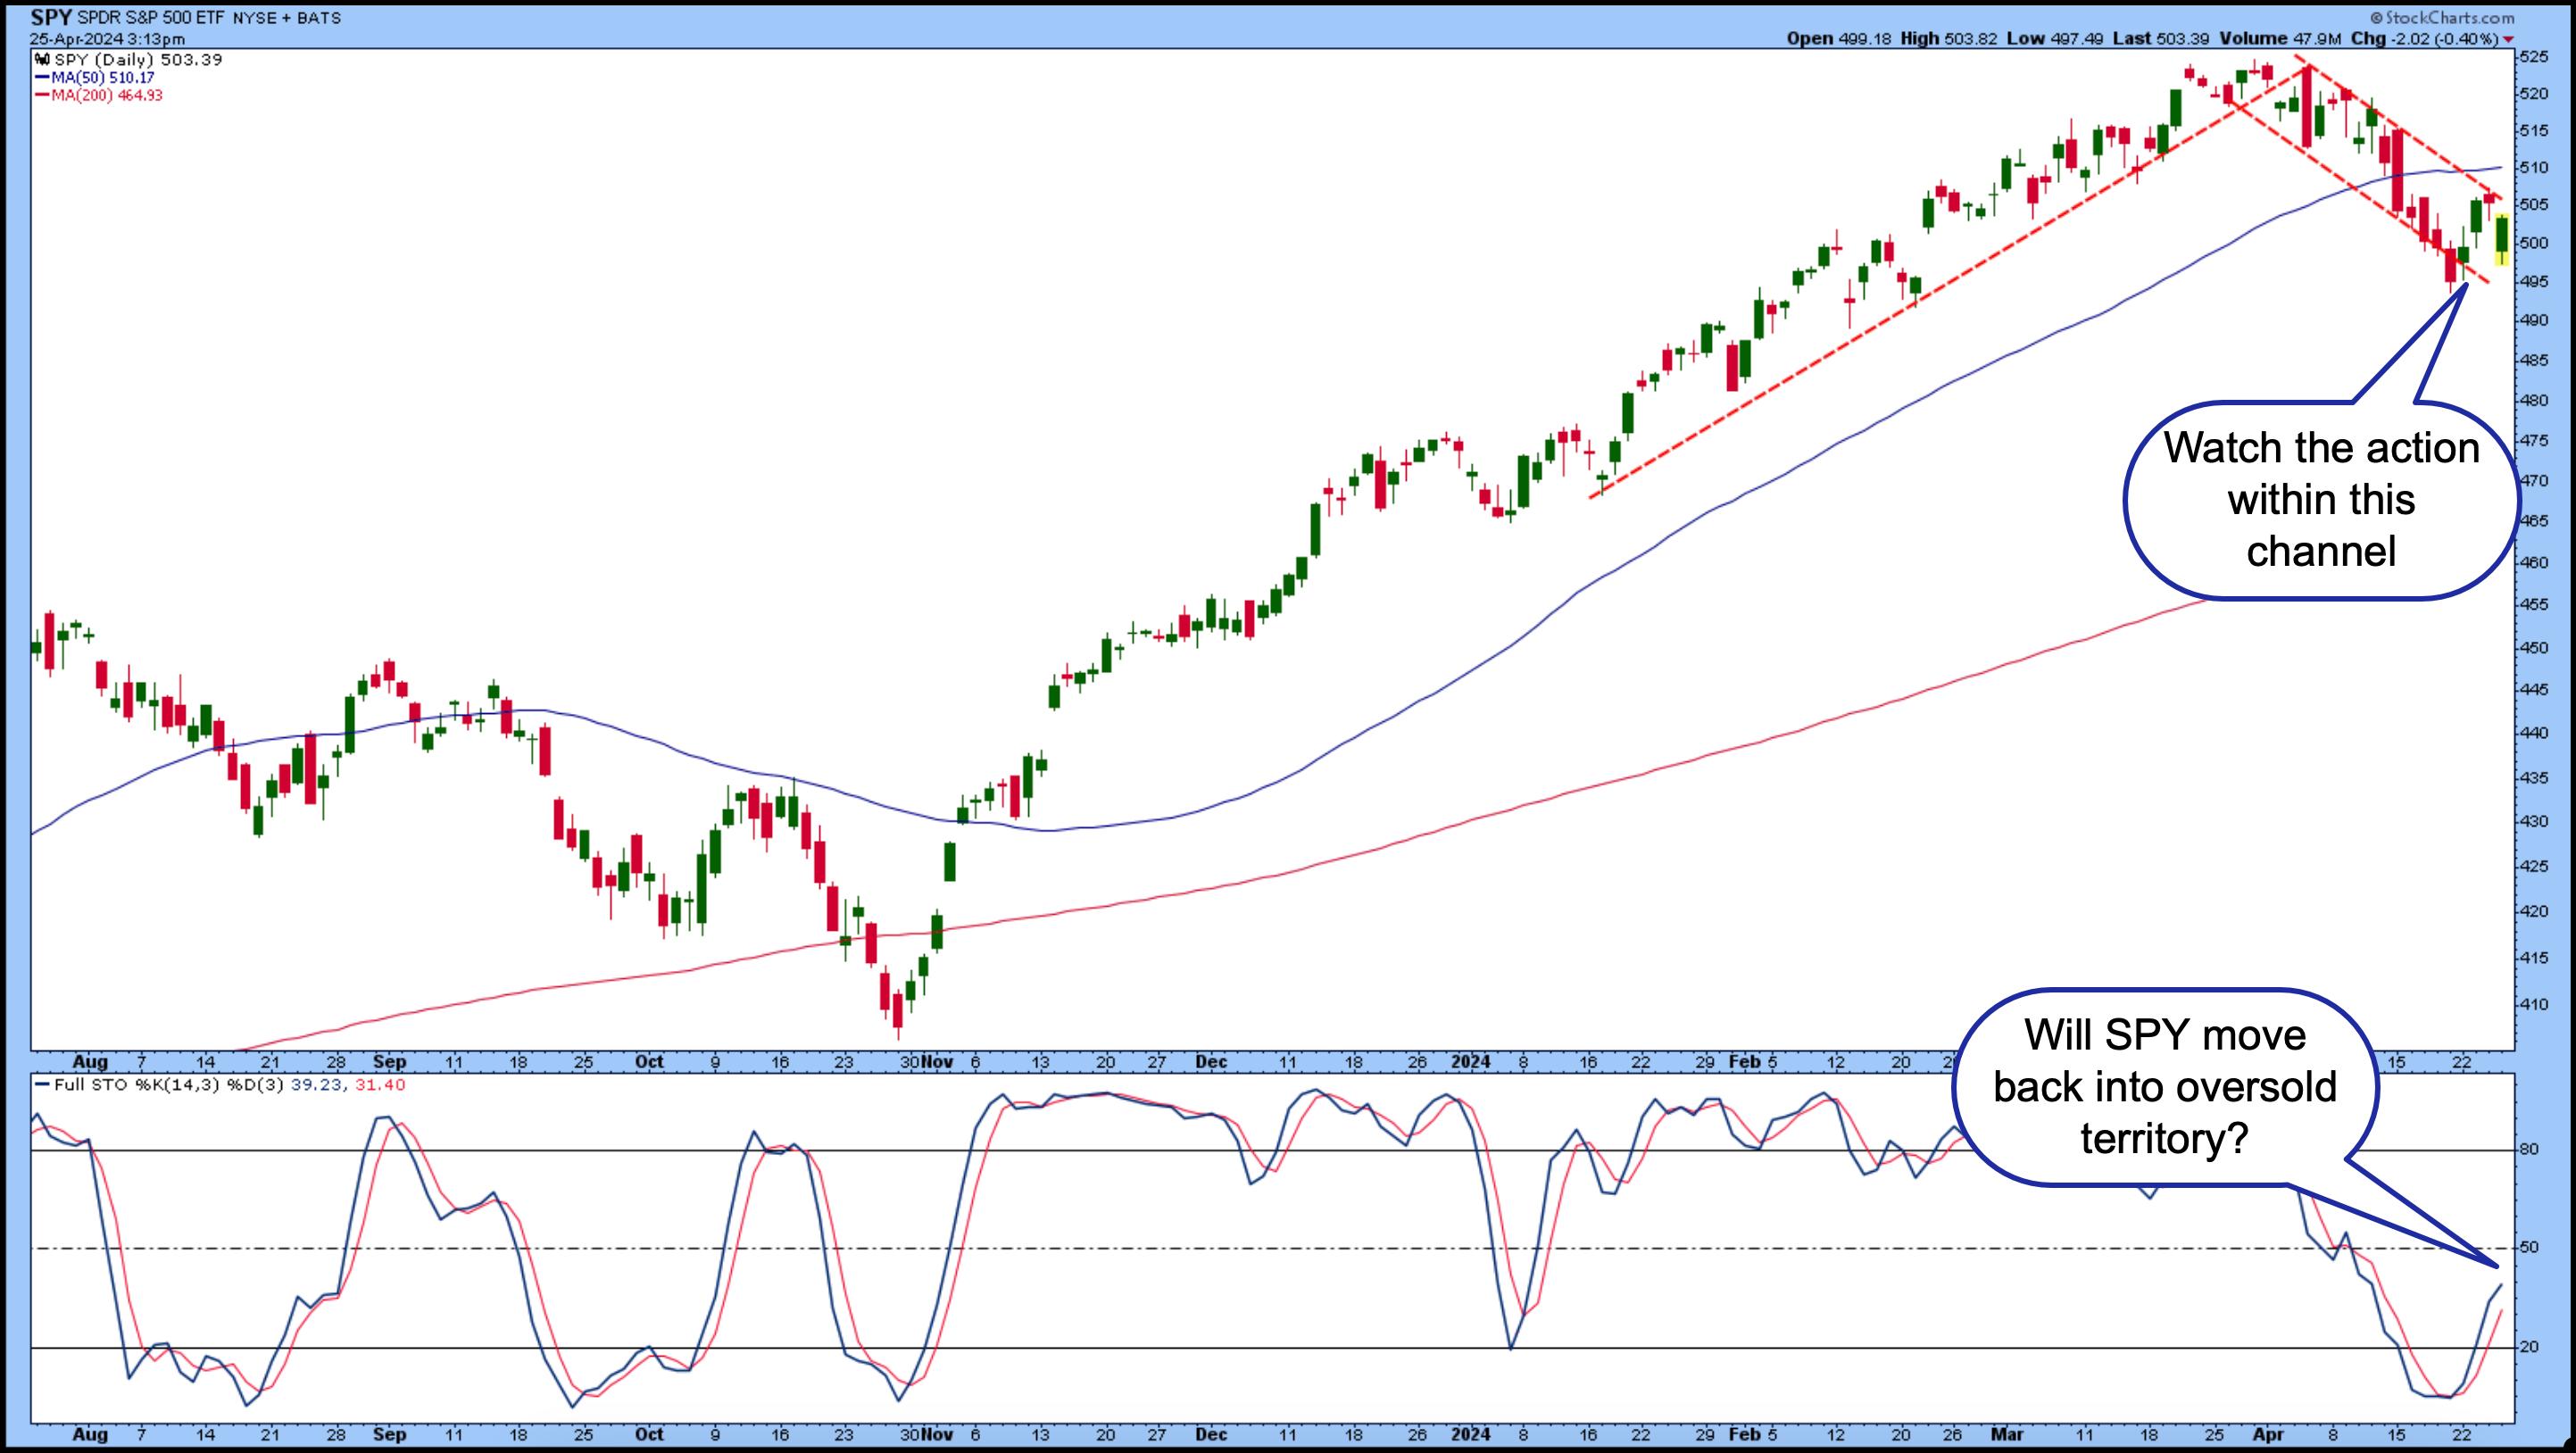
CHART 1. DAILY CHART OF SPY. The ETF looks like it wants to move higher, but it’s still trading within its downward channel. SPY is also moving out of its oversold territory, although it could quickly turn lower.Chart source: StockCharts.com. For educational purposes.
The following three scenarios could play out:
- SPY could continue to bounce around in the downward price channel for longer.
- It could break out above the channel and set up for a reversal.
- It could break down below the lower channel line and fall towards its next support level.
It’s helpful to add an indicator that helps determine if the market is oversold or overbought. In this example, the Stochastic Oscillator (lower panel) is applied. It shows that SPY was in oversold territory after Friday’s close, but is now out of that area, although it could easily and quickly turn lower and go back below 20.
View the live chart.
If you look up the weekly chart of SPY (see below), the uptrend looks like it’s still in play. SPY is trading above its 50-day SMA and is no longer in overbought territory (see Stochastic Oscillator in lower panel). Although SPY has broken below the shorter-term trendline, the pullback looks much healthier than in the daily chart.
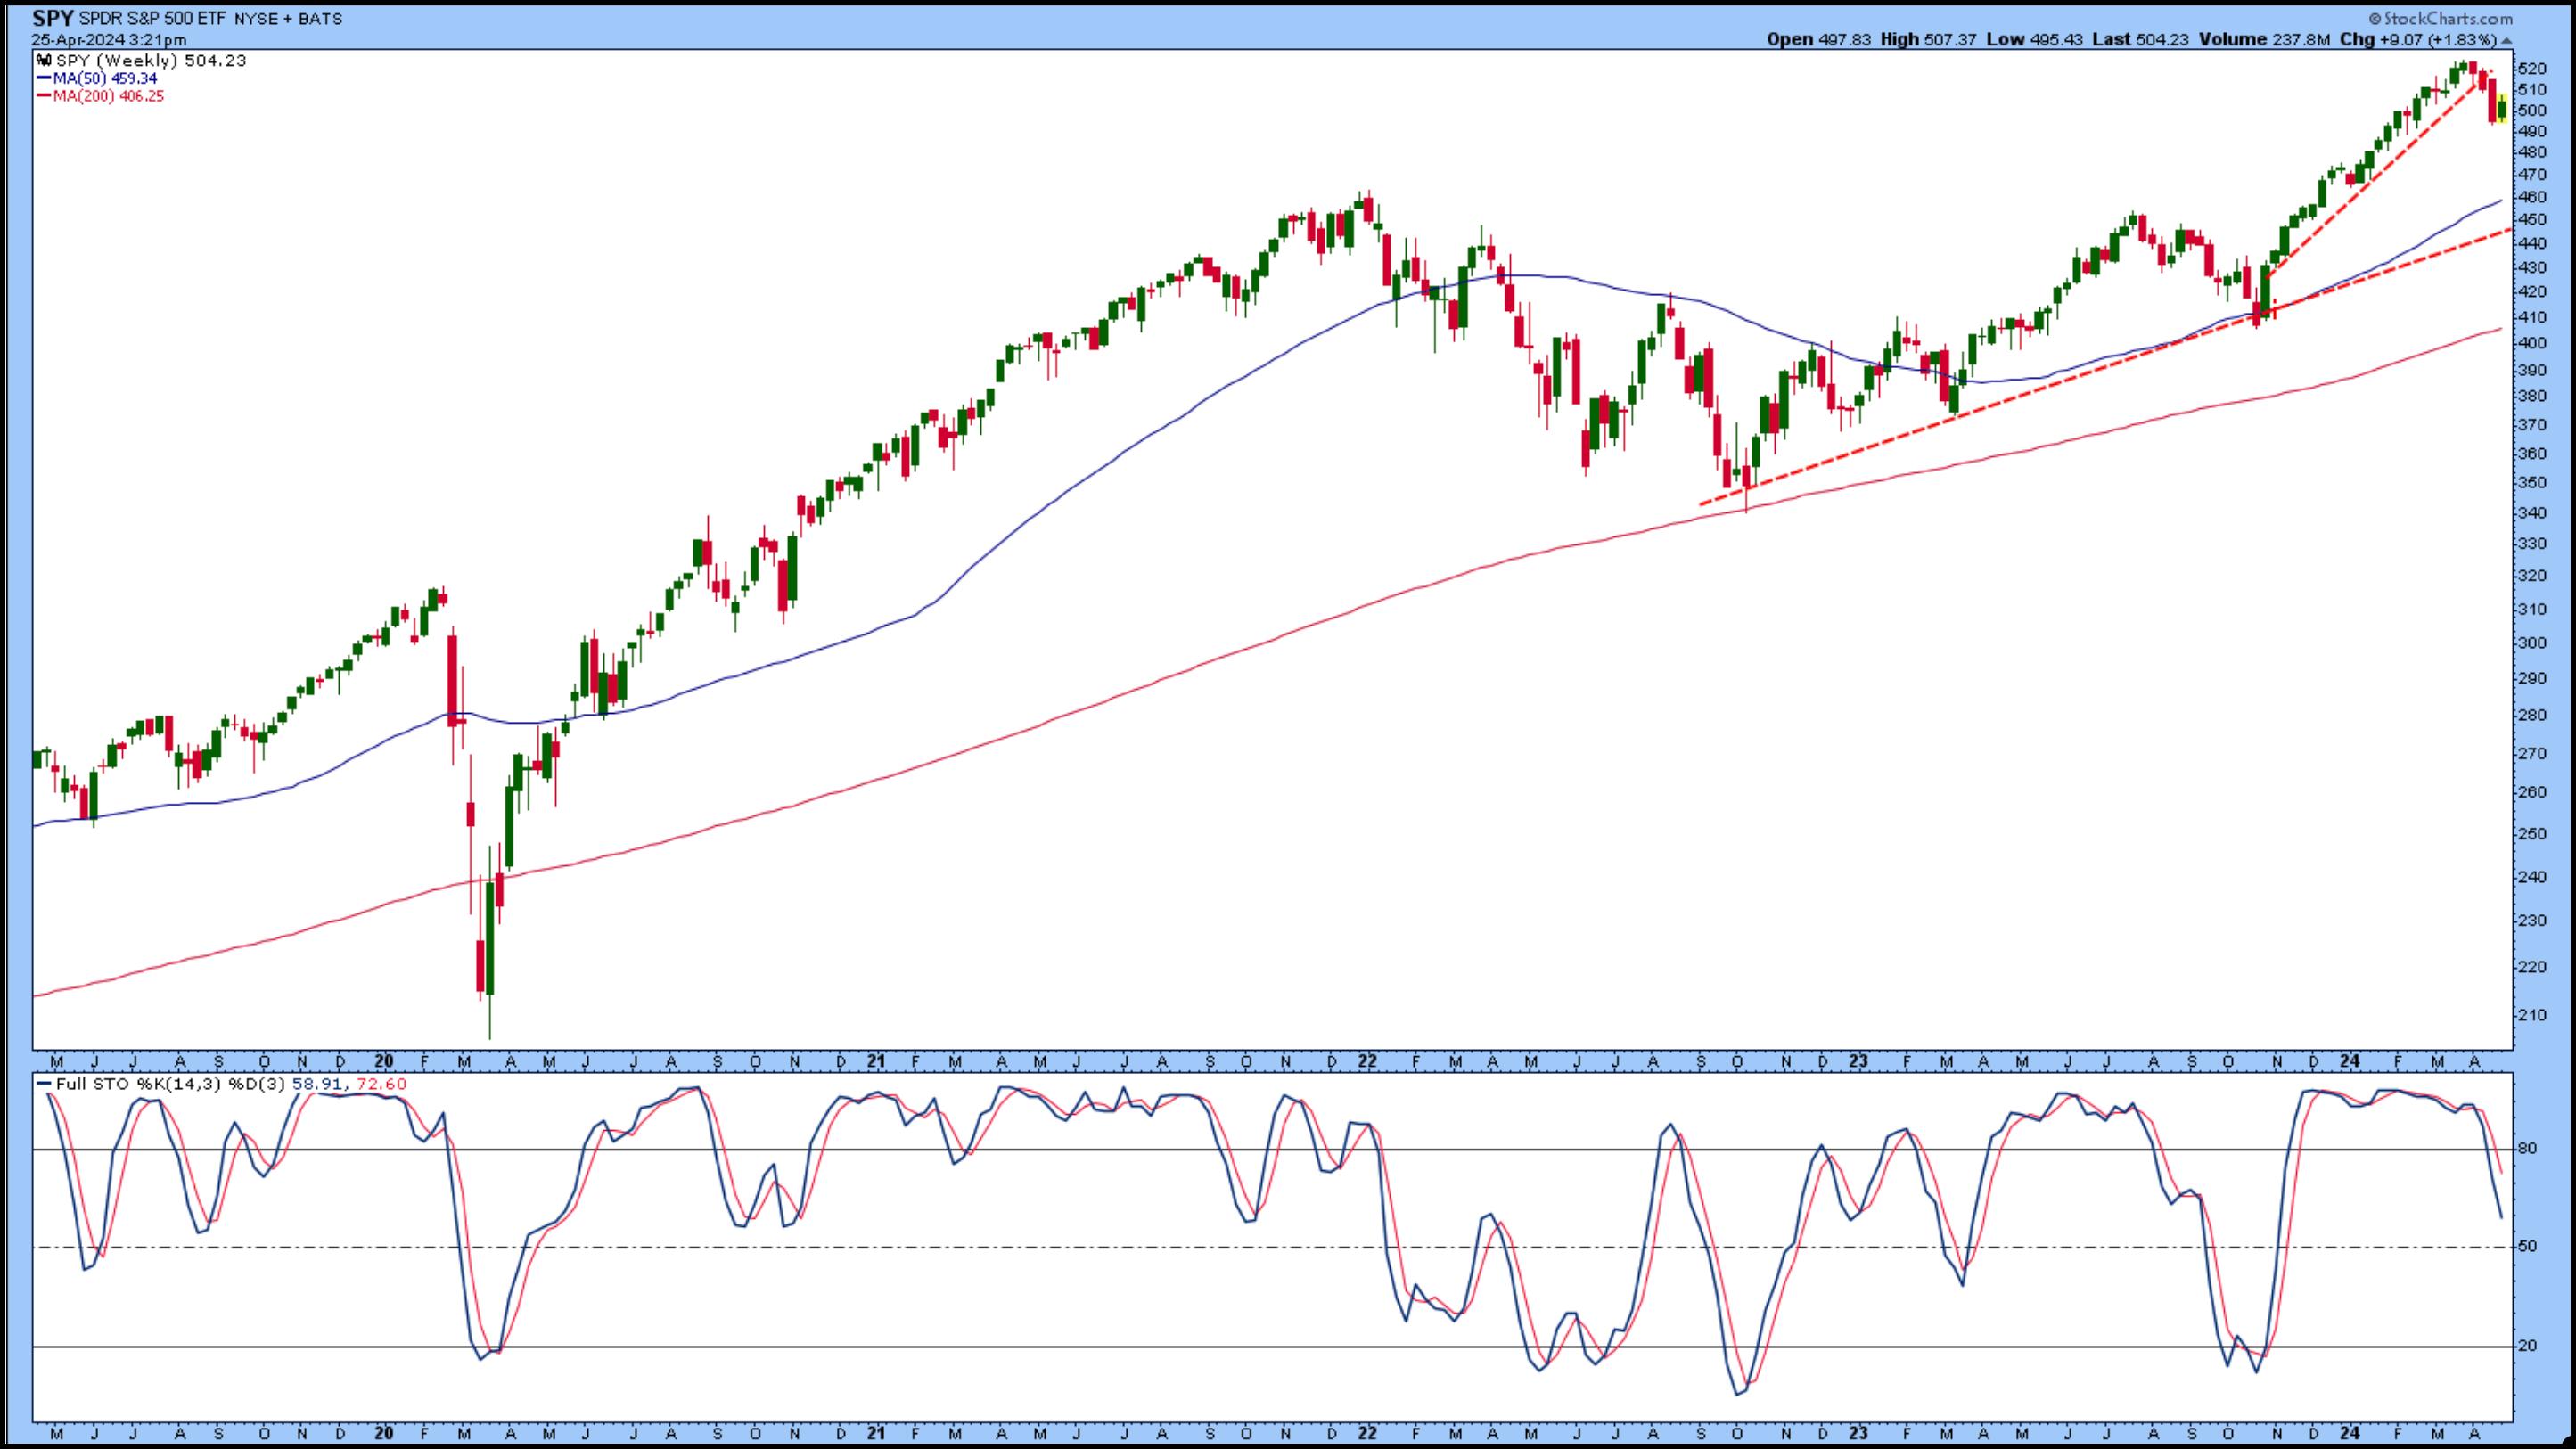
CHART 2. WEEKLY CHART OF SPY. Over the long-term, SPY’s uptrend still looks in play. If it dips below its 50-day SMA and the Stochastic Oscillator sinks into oversold territory, there may be reason to be concerned.Chart source: StockCharts.com. For educational purposes.
The market’s behavior changes from day to day, and right now it looks like any bad news hurts the equity indexes. If you’re trying to decide whether to unload some of your positions or considering adding new positions to your portfolio, it’s best to exercise patience and wait for the market to decide which way it’s going to go.
Set up a ChartList with the indexes or their ETF proxies and sector ETFs—DIA, QQQ, SPY, XLK, etc. Annotate the lines in the sand (trendlines, support/resistance lines, significant highs/lows) and view them as a CandleGlance so you can see all the charts simultaneously.
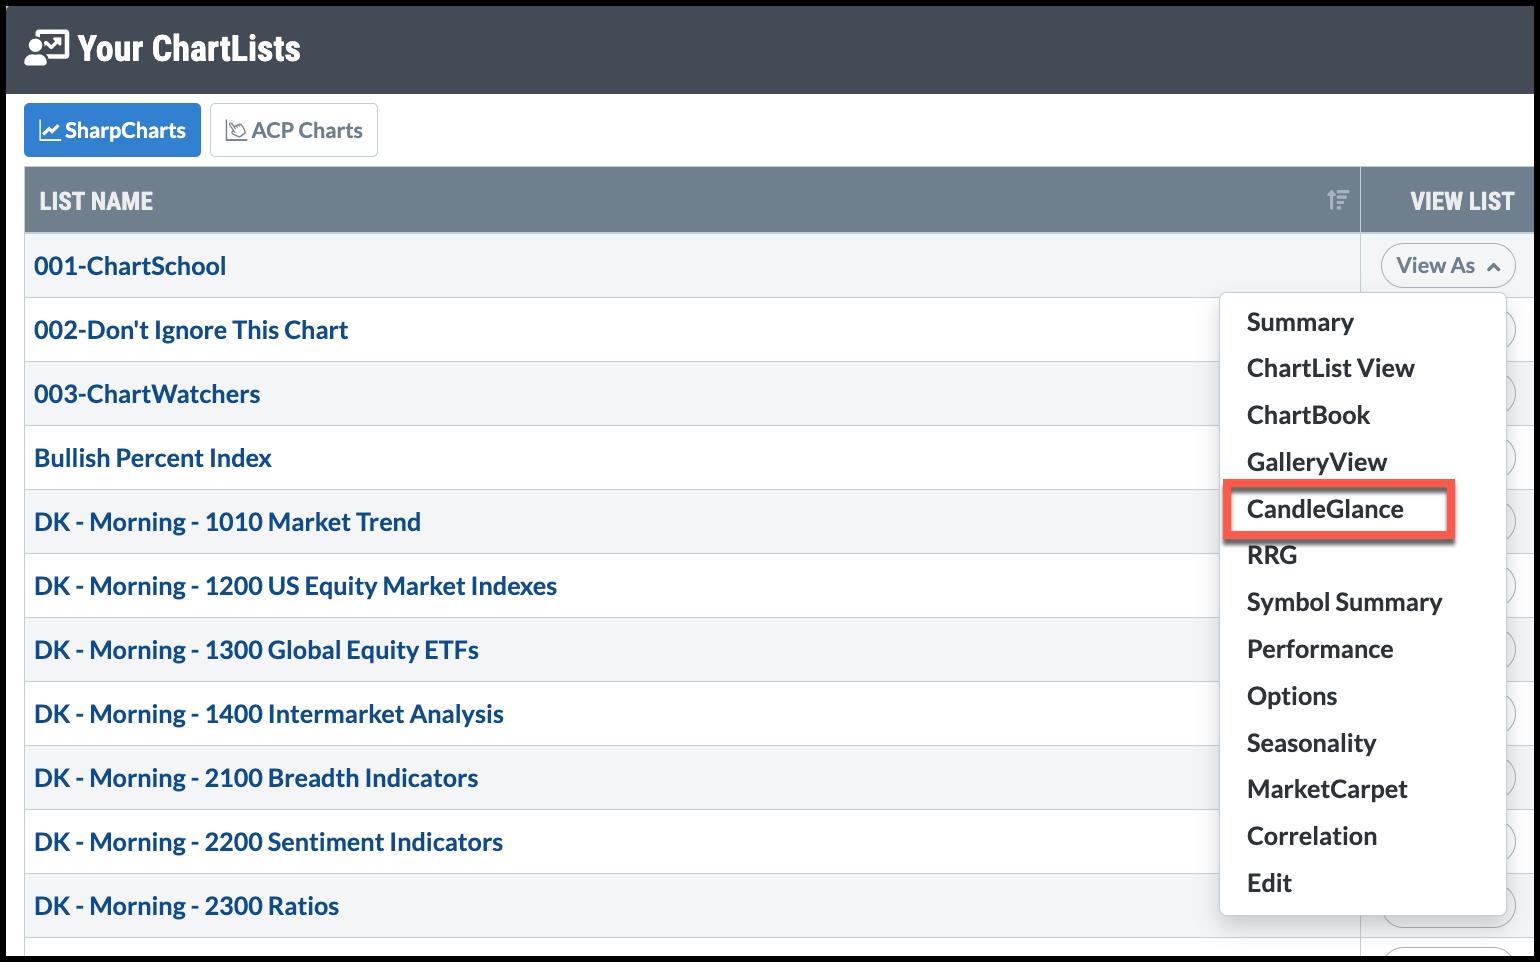
FIGURE 3. HOW TO VIEW CHARTLISTS. There are different ways to view your ChartLists. CandleGlance helps you view all charts simultaneously, giving you a bird’s eye view of stock market action.Chart source: StockCharts.com. For educational purposes.
This helps to identify which ETFs are breaking above strong resistance levels and which are breaking below support levels. Anything can change the market’s narrative, so watch the action closely.

Disclaimer: This blog is for educational purposes only and should not be construed as financial advice. The ideas and strategies should never be used without first assessing your own personal and financial situation, or without consulting a financial professional.