

Tesla’s (TSLA) first-quarter earnings reported after Tuesday’s market close was lackluster, bordering on disastrous. Yet the stock jumped 16% Wednesday morning, ripping open a wide breakaway gap from the previous day’s close.
What happened? Well, Elon Musk framed the dismal numbers with a compelling narrative that elevated its underperformance into a story about future growth. But does the story have enough fundamental fuel to break above the FOMO?
From Sinking Ship to Skyrocket
Here’s a brief account of what happened on Tuesday: TSLA’s revenue in the quarter fell by 9%, its vehicle production and deliveries were also down 2% and 9%, respectively, its operating income and adjusted EPS plunged by 56% and 47%, and its operating cash flow cratered by 90%.
These figures alone would have tanked TSLA’s stock price. So, what happened? Musk got TSLA prices flying with two sentences that essentially said the company is expediting the building of cheaper EVs based on the current models. Cheaper Tesla EVs mean a surge in demand and, by extension, growth.
TSLA Stock: A Macro Look
Click here for a live chart.

In the weekly chart of TSLA below, the stock has been trading lower since peaking in October 2021 (even considering its attempt at recovery in early 2003). TSLA’s stock price is close to its 2023 low.
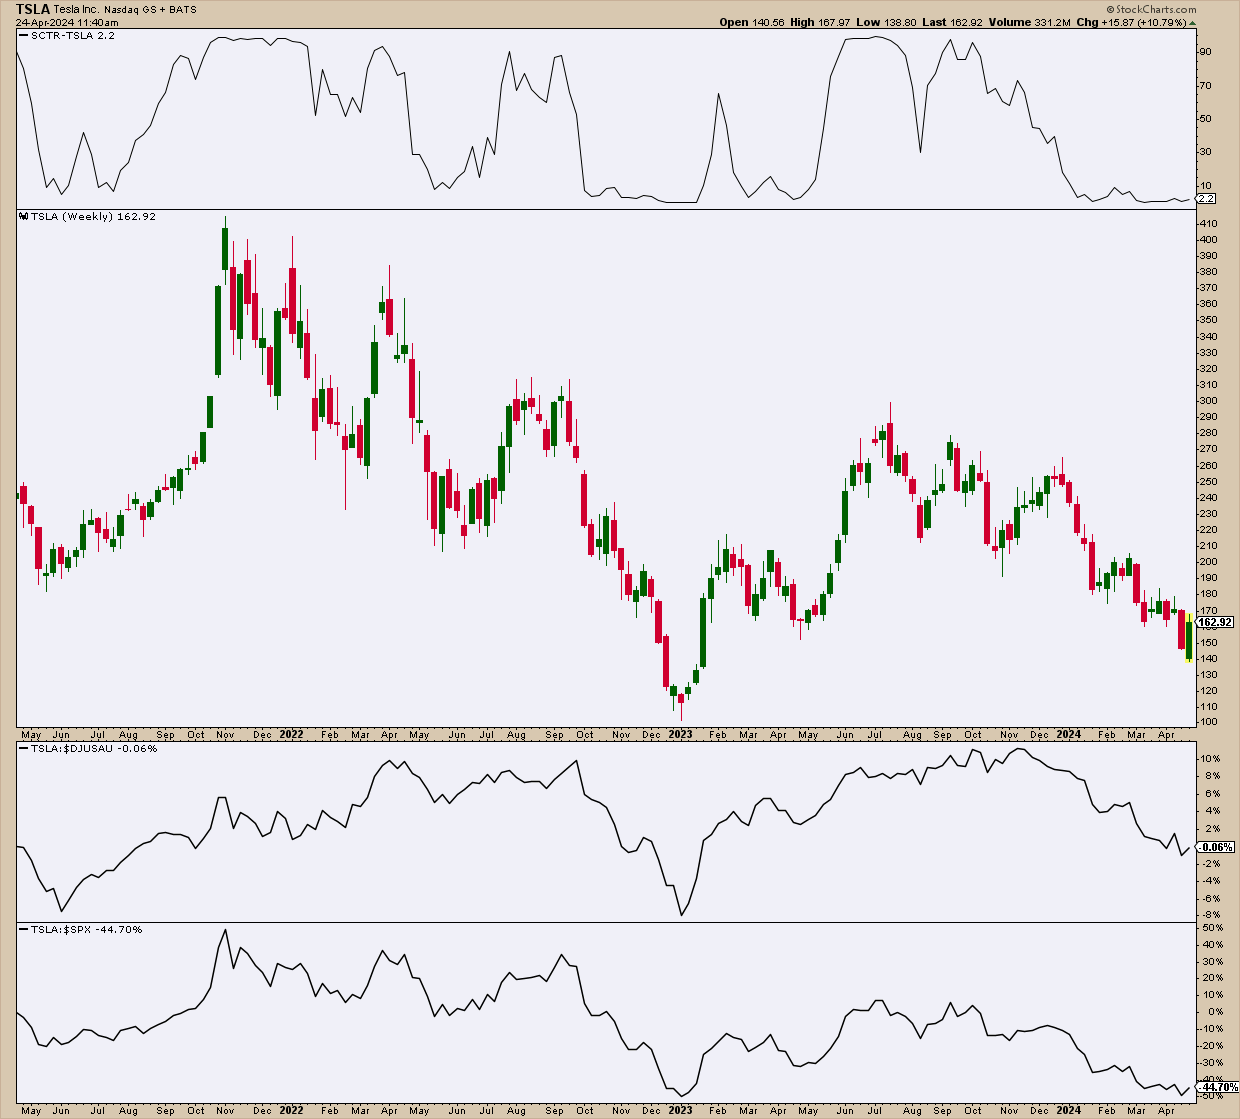
CHART 1. WEEKLY CHART OF TSLA. Despite the recovery attempt in early 2023, the longer-term trend has been down since 2021.Chart source: StockCharts.com. For educational purposes.
Currently, TSLA holds one of the worst StockCharts Technical Rank (SCTR) scores at 2.2, a few steps from zero. While the leading EV maker’s performance was in sync with its industry ($DJUSAU), it badly underperformed the S&P 500 by more than -45%.
Flying High on FOMO?
Click here for a live chart.

Now, take a look at the near-term price action in the daily chart of TSLA (see below). The stock exhibited a sudden burst of escape velocity to the upside after hitting a 52-week low.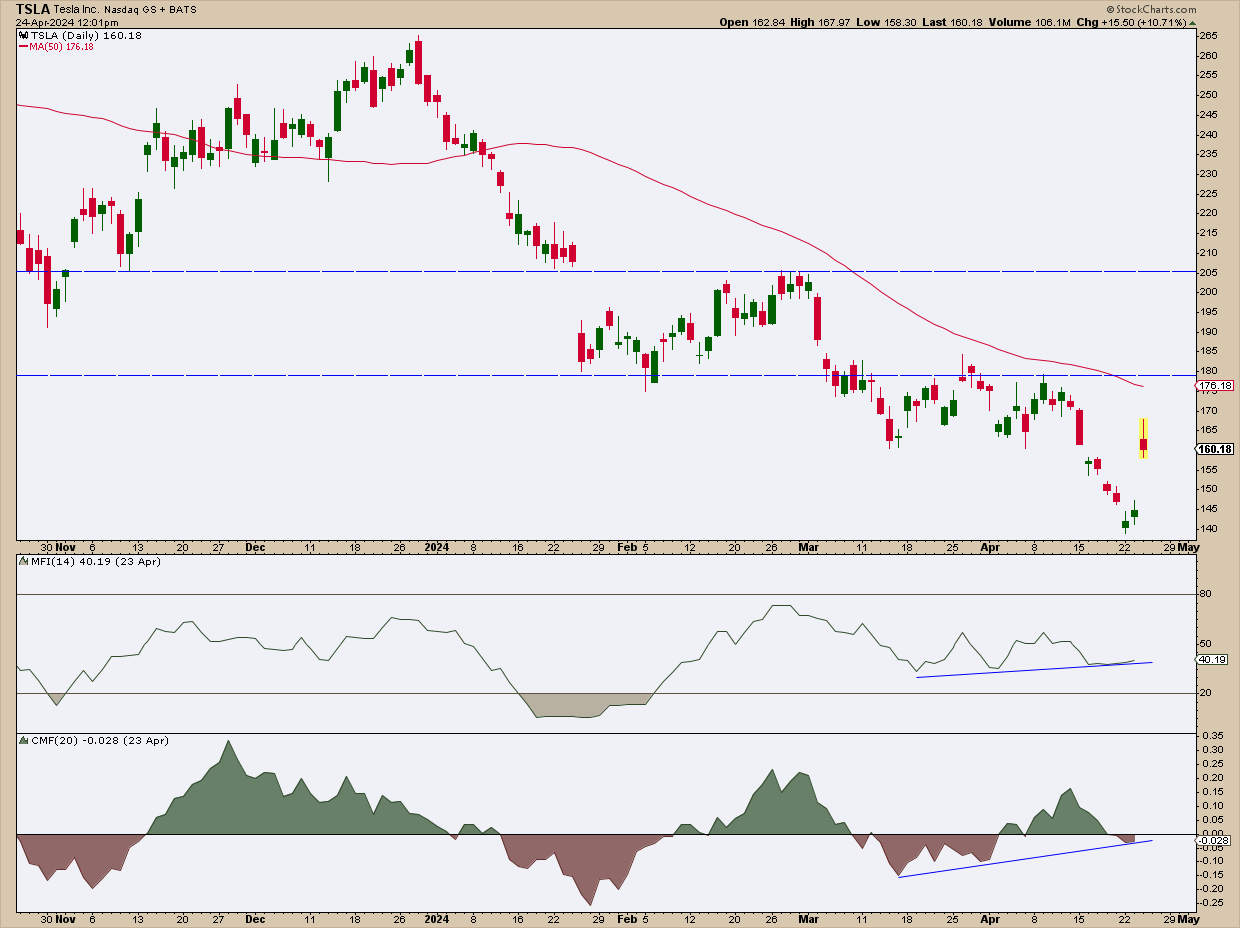
CHART 2. DAILY CHART OF TSLA. Breakaway gaps are bullish, TSLA’s narrative is also bullish, but the rest of the technicals are iffy.Chart source: StockCharts.com. For educational purposes.
Breakaway gaps toward the upside are characterized by a powerful shift driven by intense sentiment. They rarely get filled right away.
TSLA’s 16% post-earnings gap is a strong bullish gesture, but notice the strong rejection in the current candle. This indicates, if anything, that the volume driving the gap may not be enough to give it a follow-through in the coming sessions (it’s a wait-and-see moment). While the Money Flow Index (MFI) and Chaikin Money Flow (CMF) (the latter dipping back below the zero line) show an ever-so-slight divergence which might be interpreted as bullish, any surge from this point on will face a few technical headwinds above.
TSLA is trading below its 50-day simple moving average, but if it crosses above it, note the critical resistance areas at the $180 and $205 range.
Bullish or Bearish?
One day’s surge, no matter how impressive, doesn’t define a trend. Likewise, a strong twist in the fundamental narrative doesn’t mark a change in the story. As far as price targets are concerned, a survey of 30 analysts shows a wide range from a shocking $23 on the low end, a median target of $185, and a high range upwards of $310 to cap it off.
Right now, everything is riding on the promises of production. As seasoned traders know, holding out for confirmation is usually the smart play. The technical indicators map out key short-term and long-term levels, giving you a clearer view of the battleground where all this drama will play out.

Disclaimer: This blog is for educational purposes only and should not be construed as financial advice. The ideas and strategies should never be used without first assessing your own personal and financial situation, or without consulting a financial professional.