
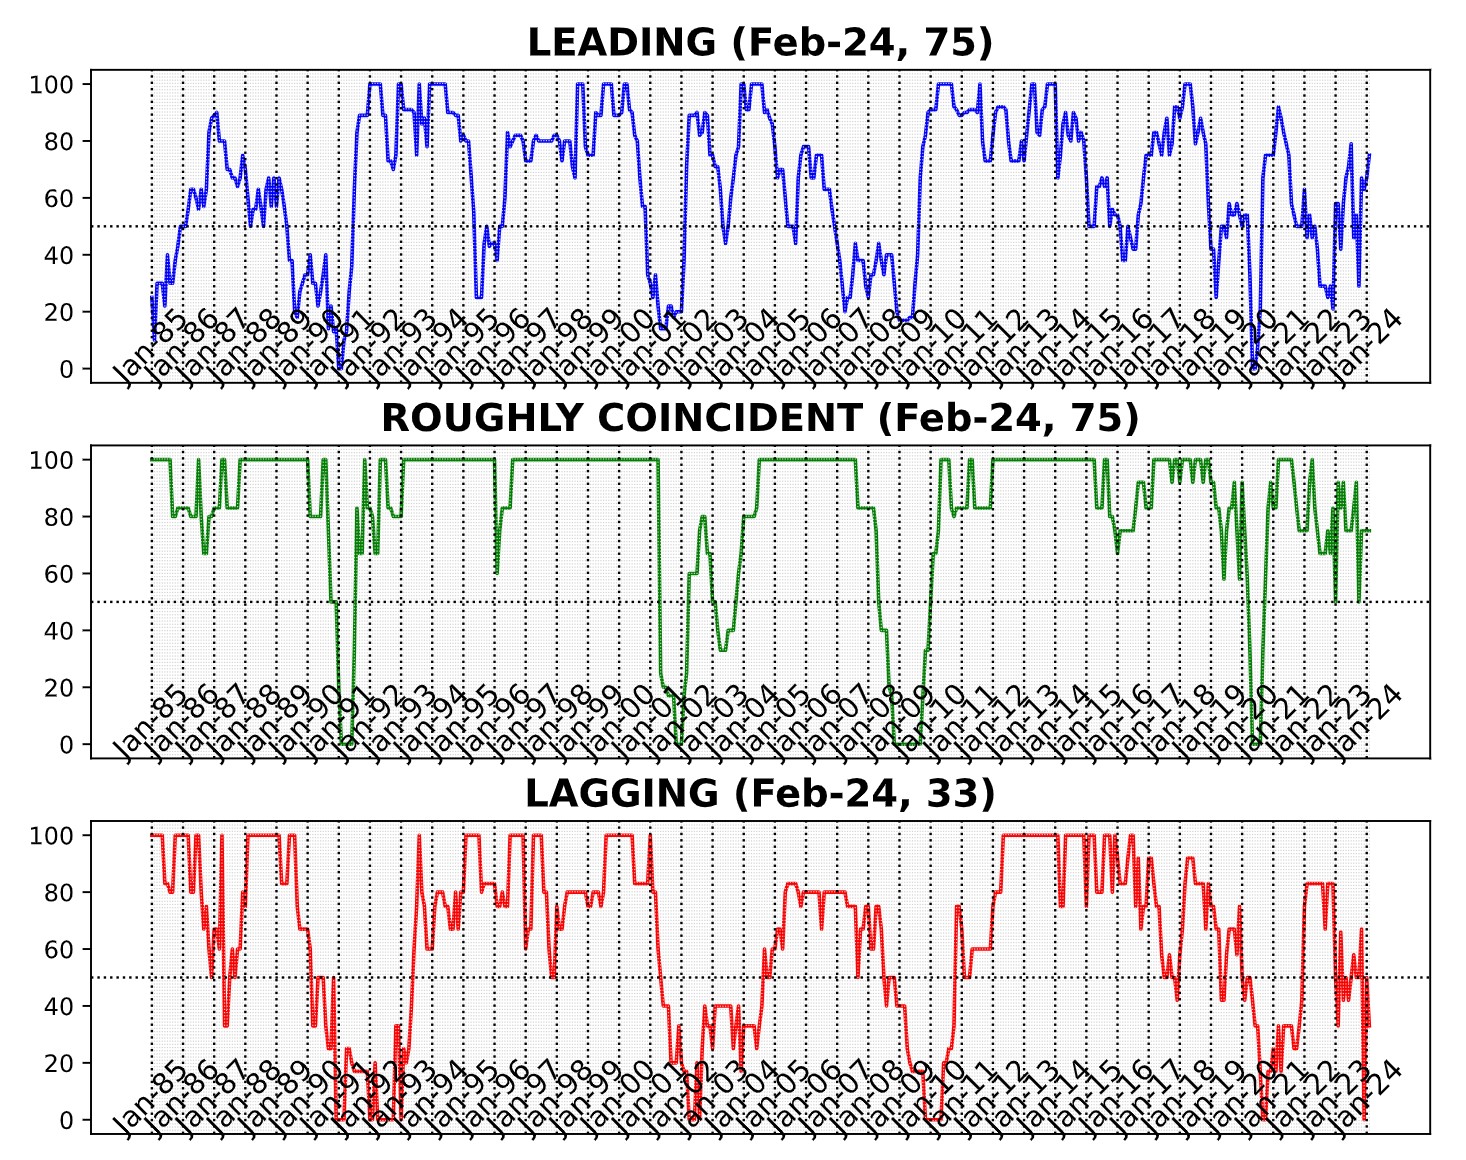
In February 2023, the AIER Business Conditions Monthly demonstrated divergent signals yet again. The Leading Indicator rose from 67 to 75 with the Roughly Coincident Indicator spending a fourth month at the 75 level. The Lagging Indicator, which dropped to 0 in December 2023 before rebounding to 50 in January fell back again to 33.
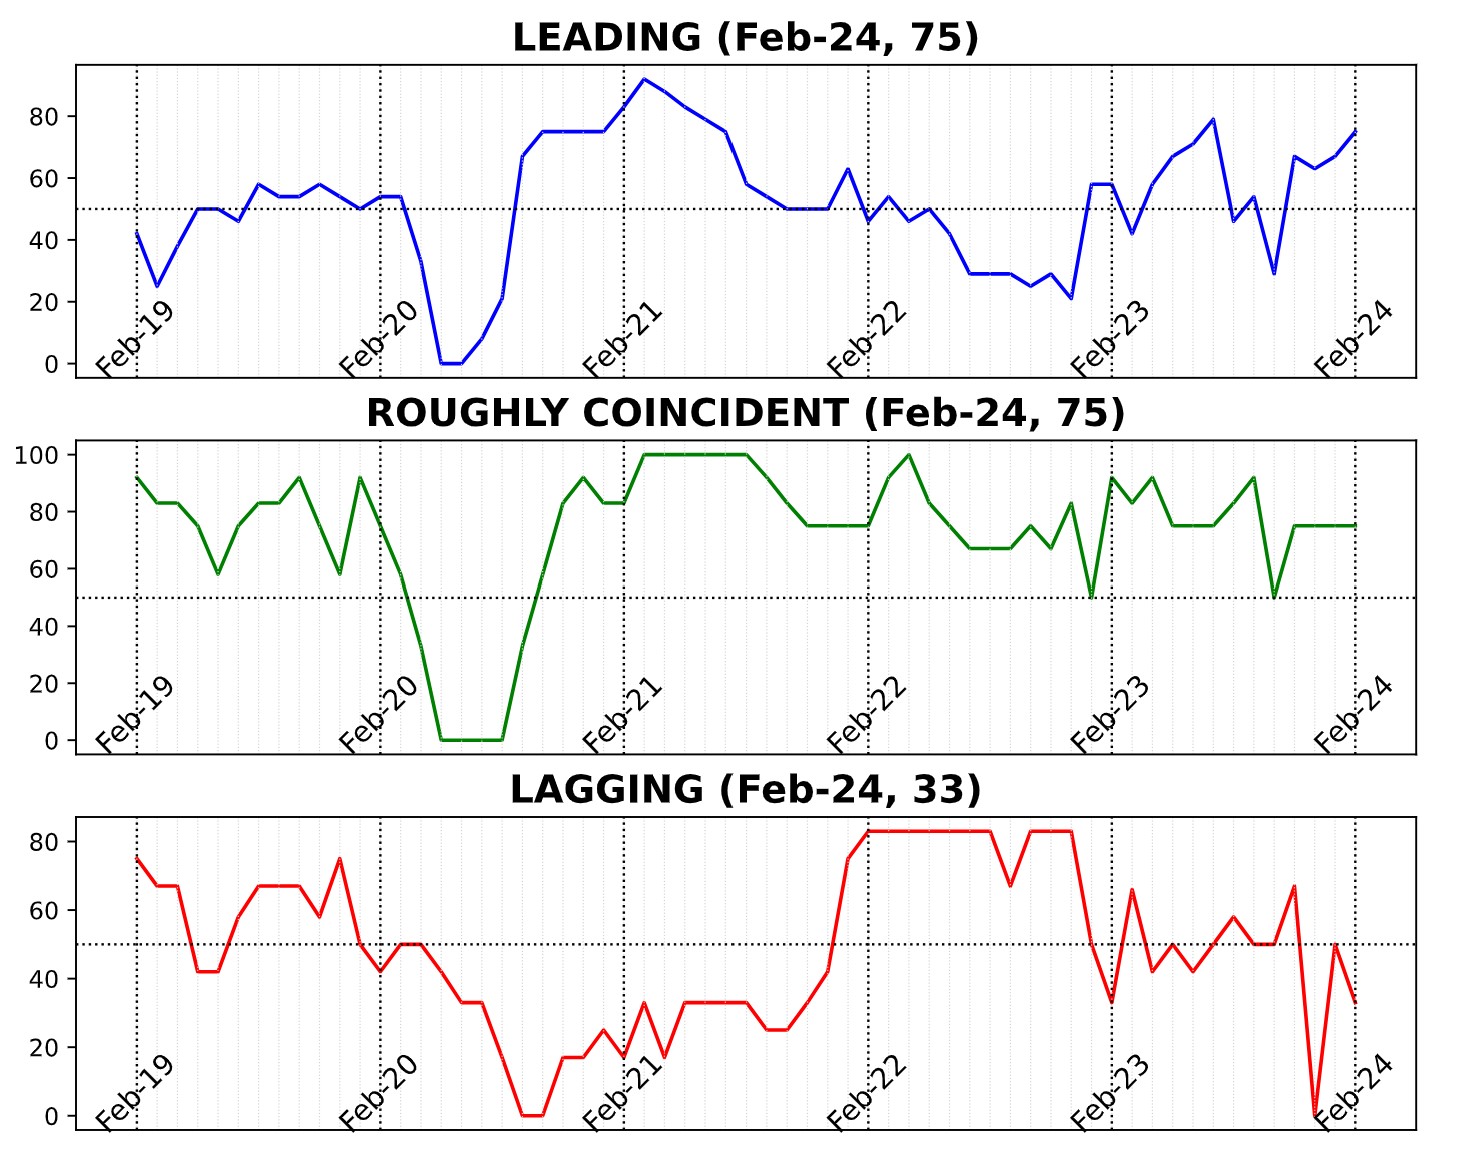
Leading Indicator (75)
Among the twelve components of the Leading Indicator, seven rose and five declined.
Rising in February 2023 were the US New Privately Owned Housing Units Started by Structure Total SAAR (12.7 percent), FINRA Customer Debit Balances in Margin Accounts (5.9 percent), Conference Board US Leading Index Stock Prices 500 Common Stocks (4.3 percent), Adjusted Retail & Food Services Sales Total SA (0.9 percent), Conference Board US Manufacturers New Orders Nondefense Capital Good Ex Aircraft (0.6 percent), US Average Weekly Hours All Employees Manufacturing (0.5 percent), and the Conference Board US Leading Index Manuf New Orders Consumer Goods & Materials (0.1 percent). The five declining components were the Inventory/Sales Ratio: Total Business (-0.7 percent), United States Heavy Trucks Sales SAAR (-1.6 percent), University of Michigan Consumer Expectations Index (-2.5 percent), US Initial Jobless Claims (-5.3 percent), and the 1-to-10 year US Treasury spread (-6.4 percent).
The Leading Indicator, at 75, suggests a sustained level of moderate growth, maintaining a consistent trend within the range of above-neutral performance observed over the past year.
Roughly Coincident (75) and Lagging Indicators (33)
Among the six constituents of the Roughly Coincident indicator four rose, one was neutral, and one declined in February. US Industrial Production (0.4 percent), Conference Board Coincident Personal Income Less Transfer Payments (0.2 percent), Conference Board Coincident Manufacturing and Trade Sales (0.2 percent), and US Employees on Nonfarm Payrolls (0.2 percent) rose. The US Labor Force Participation Rate was unchanged, and the Conference Board Consumer Confidence Present Situation SA 1985=100 declined 4.8 percent.
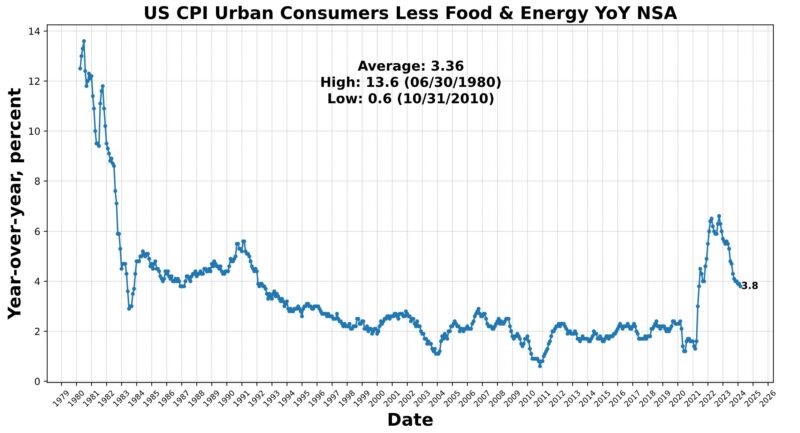
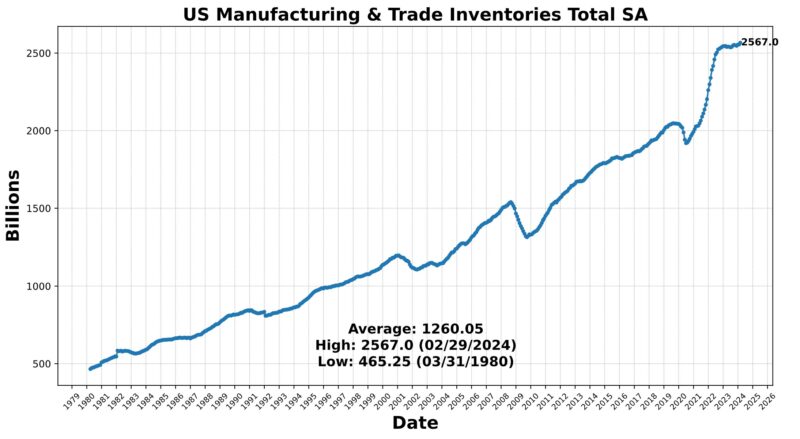
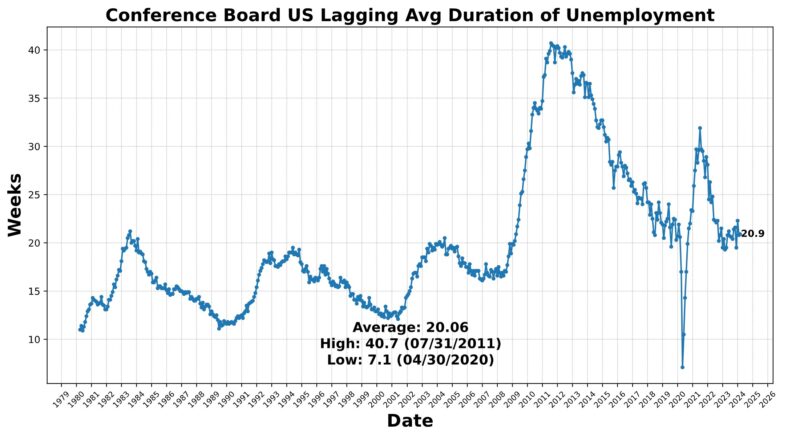
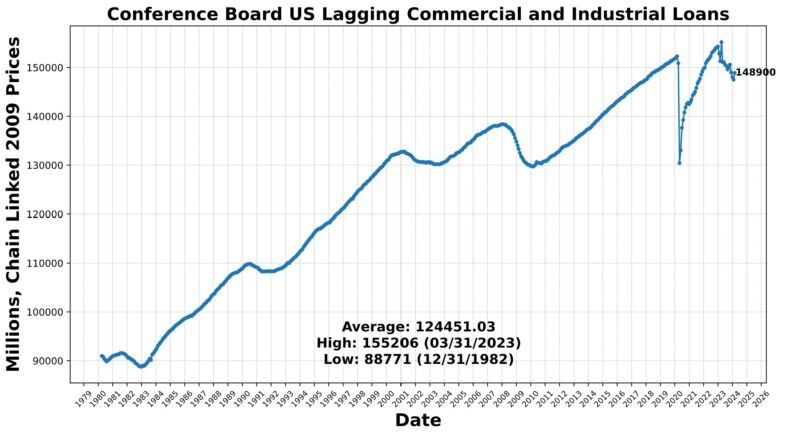
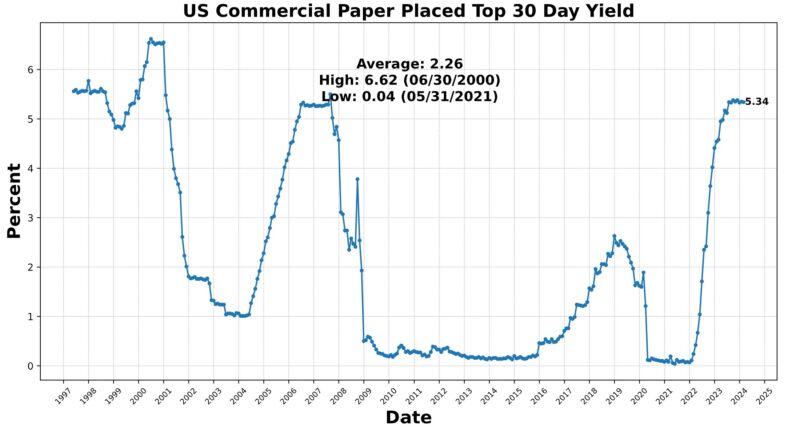
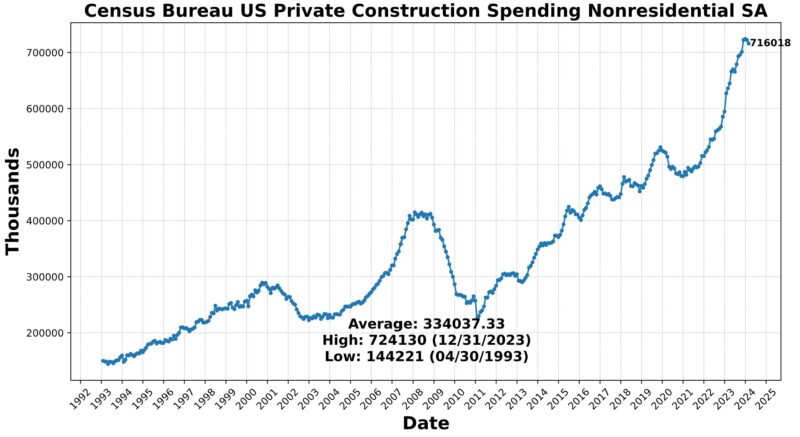
The Lagging Indicator had three rising and three falling components. In the first category were the Conference Board US Lagging Commercial and Industrial Loans (0.9 percent), Conference Board US Lagging Avg Duration of Unemployment (0.5 percent), and US Manufacturing & Trade Inventories Total (0.5 percent). US Commercial Paper Placed Top 30 Day Yield fell 0.2 percent, as did Census Bureau US Private Constructions Spending Nonresidential (-0.9 percent) and US CPI Urban Consumers Less Food & Energy year-over-year (-2.7 percentAt the 75 level for four months now, the Roughly Coincident Indicator suggests relative stability of moderate growth. In contrast, the Lagging Indicator suggests moderate contraction, continuing a pattern of sizable fluctuations from month to month.
Discussion
The release of the Fed’s Beige Book on April 17, 2024, provided insights into economic conditions across various regions of the US. The first quarter of 2024 was characterized by a “slight” expansion, aligning with previous downbeat descriptions of activity. Ten Federal Reserve districts reported growth compared to eight in February, although consumer spending showed a minimal increase, which contrasts with recent retail sales figures. Among other trends noted were increasing price sensitivity and reduced discretionary spending. Respondents to Fed surveys expressed cautious optimism about growth, although employment growth remained modest with ongoing labor shortages in certain sectors. Wage pressures continued to ease, while inflation remained steady, though some districts reported increasing pressure on margins due to difficulty in passing on price increases, posing potential upside risks.
The March industrial production report presented an upside surprise, exceeding initial expectations. Manufacturing production, in particular, showed unexpected strength, with February’s data revised upward, setting a higher base for measuring monthly growth. The surge in production was fueled by robust consumer demand for automobiles, traditionally an interest-sensitive sector, as well as fuel. With consumer demand resilient and survey data indicating strengthening conditions, it may be the case that US industrial production has surpassed its previous trough. Not only did deadline industrial production grow in March, aligning with consensus and expectations, but February’s figures were revised up substantially from 0.1 percent to 0.4 percent. Notably, manufacturing production outperformed forecasts, rising by 0.5 percent during the month, exceeding both survey expectations and consensus estimates. The increase in consumer goods production, particularly in automobiles and parts, contributed significantly to this growth. Durable-goods manufacturing and production of nondurable goods also made substantial contributions to monthly industrial-production growth.
The employment landscape depicted by the Bureau of Labor Statistics’ establishment survey (which polls roughly 144,000 businesses) and household survey (which surveys roughly 60,000 families) have diverged significantly of late, revealing contrasting economic realities. Sectors buoyed by spending from asset-appreciation beneficiaries (leisure, hospitality, and healthcare, among others) are showing robust employment gains while other sectors are witnessing reduced demand. The latter tend to be associated with lower-income consumers, and are experiencing slowing growth and hiring limitations. This disparity is likely to persist, exacerbating difficulties in interpretation.
Recent strength in nonfarm payrolls data has outpaced expectations, averaging around 250,000 new jobs per month. This is more than twice the Federal Reserve’s estimated steady state pace of 100,000 per month. A prevailing theory attributes that robust growth to the incredible surge in immigration over the past few years, suggesting that a new, higher neutral hiring pace of from 150,000 to 250,000 per month.
Yet there is cause for skepticism regarding the accuracy of nonfarm payrolls in capturing undocumented workers. The household survey likely offers a more accurate reflection of labor market health than the establishment survey does. Despite the consensus view, the household survey indicates a cooling labor market, challenging the notion of continued robust hiring amidst an influx of migrants. Methodological differences between the establishment and household surveys underpin the discrepancy, with the household survey more effective in recording the employment of potentially undocumented workers. While the establishment survey captures jobs more prone to pro-cyclical fluctuations – such as temporary positions and “gig economy” work – the household survey provides a more comprehensive picture of labor market dynamics.
Consequently, policymakers may need to recalibrate their assessment of the economy’s capacity to absorb a significant influx of low-skilled migrants amidst mounting labor market slack. Recent policy changes, such as California’s significant minimum wage hike are additionally impacting employment dynamics, exacerbating the softening in the labor market. Despite the strength in nonfarm payrolls, household survey data suggest weaker employment gains, reflecting a cooling labor market.
The March’s Consumer Price Index (CPI) data presented a concerning signal for the ongoing fight against inflation, especially considering the favorable seasonal patterns typically conducive to disinflation during this period. Both headline and core CPI remained unchanged from February, with year-over-year figures ticking up slightly. Of particular note is the persistent momentum in core CPI on various timescales, indicating that progress on disinflation may have stalled or effectively stopped. Notably, energy prices and shelter costs continue to be primary drivers of inflation, with gasoline prices and rents contributing significantly to headline CPI growth. Furthermore, core services, particularly transportation services, are experiencing notable inflationary pressures reflective of the lingering effects of price increases in new and used vehicles.
Despite some encouraging signs of disinflation in certain categories, such as core goods, the diffusion of disinflation remains uneven. Monetary policy’s effectiveness in curbing inflationary pressures appears to be improving, as evidenced by declining price pressures in some interest-sensitive spending categories. However, the share of core spending categories experiencing outright deflation remains relatively high, indicating ongoing challenges in achieving broad-based disinflation.
In light of these developments, and evidenced by statements made by Fed officials in recent weeks, policymakers are reassessing their inflation outlook and the consequent policy trajectory. It is quite likely that the Fed’s timeline for rate adjustments will be delayed. Market-implied policy rate markets, which late in 2023 predicted five or six rate cuts in 2024 have downgraded their forecast to two.
Amidst mixed economic data reminiscent of most of the past two years, there are pockets of strength which are nevertheless overshadowed by inflation concerns and speculation regarding monetary policy actions in the coming quarter or two. Labor markets are cooling, adding to the uncertainty surrounding the trajectory of the US economy. Notably, both the spot price of gold and the S&P 500 have reached record highs in close succession on multiple occasions in the past month, handily reflecting market-expressed uncertainty about the economic outlook. While the likelihood of a pronounced economic contraction seems to be diminishing, classic indicators of recession continue to strongly signal a downturn within the next 12 months. The absence of a discernible path recommends objectively presenting factual data and trends devoid of bias or prognostication.
LEADING INDICATORS


ROUGHLY COINCIDENT INDICATORS


LAGGING INDICATORS
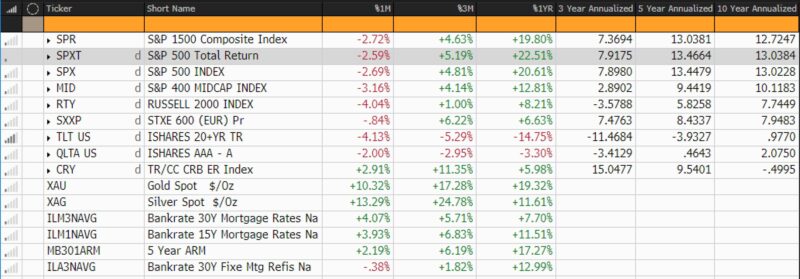
CAPITAL MARKET PERFORMANCE