


By midday Tuesday, all three US indices had taken a massive plunge as a hotter-than-expected CPI inflation report left awash in red.
What’s interesting on days like this is running a New All-Time High scan (using StockCharts’ scan engine) to see which stocks bucked the trend (even momentarily) amid such a significant downturn.

The StockCharts Scan Engine is useful for narrowing down stocks and ETFs that match certain requirements. It comes with many predefined scans that are a good starting point. As you get the hang of these scans, you can adjust them or create new ones that align with your trading goals.
Try out the StockCharts Sample Scan Library (Charts & Tools > Sample Scan Library)
Among the 37 stocks that either stayed afloat or floated higher for the bulk of the trading day, one of the most recognizable names is (drum roll…) Walmart Inc. (WMT).
What’s Driving the Walmart Buying Spree?
Maybe it’s the 3-for-1 stock split set for February 26. Or maybe it’s simpler than that—its dominance as the world’s largest retailer offering staples and discretionary items, consistent revenue growth, and reliable dividend yield, among other reasons. Also, Walmart is set to report earnings on February 20, before the market opens, and perhaps the upswing over the last two months reflects optimism toward the coming report.
Whatever the case, Walmart’s stock price is rising while the broader market is falling quite hard. Right now, investors bullish on Walmart stock are looking for an entry point, a possible dip, or both. So, let’s have at it.
Walmart Stock Price: Is Momentum Getting Stronger or Weaker?
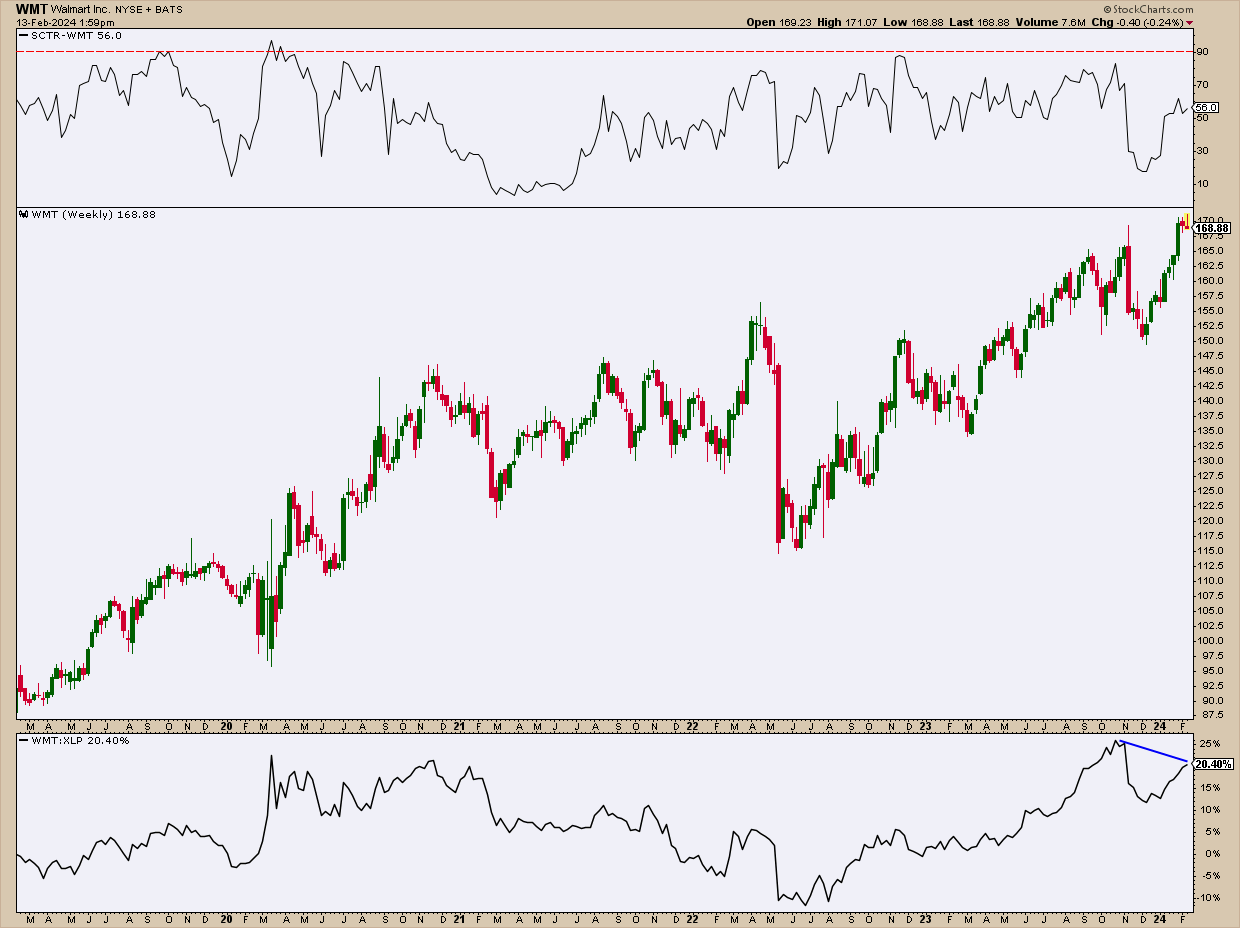
CHART 1. WEEKLY CHART OF WALMART. Note the rise in WMT’s price against falling momentum and declining relative performance compared with its sector. The SCTR score is also at around 50, which doesn’t make WMT a technically strong stock.Chart source: StockCharts.com. For educational purposes.
Despite the volatility, a wide-ranging period (in 2021), and a few significant drops, Walmart stock’s net uptrend has remained relatively solid. Still, judging from the STCR score, well below the bullish 90 line and hovering around the 56 range, its technical ranking is declining, warning of technical weakness despite Walmart’s stock price rise.
In terms of Walmart’s performance relative to the Staples sector (using the SPDR Consumer Staples Select Sector Fund XLP as a proxy), Walmart’s outperformance stands at 20%, down from 25% last October–November.
Walmart Stock Price: Bucked and Retreated
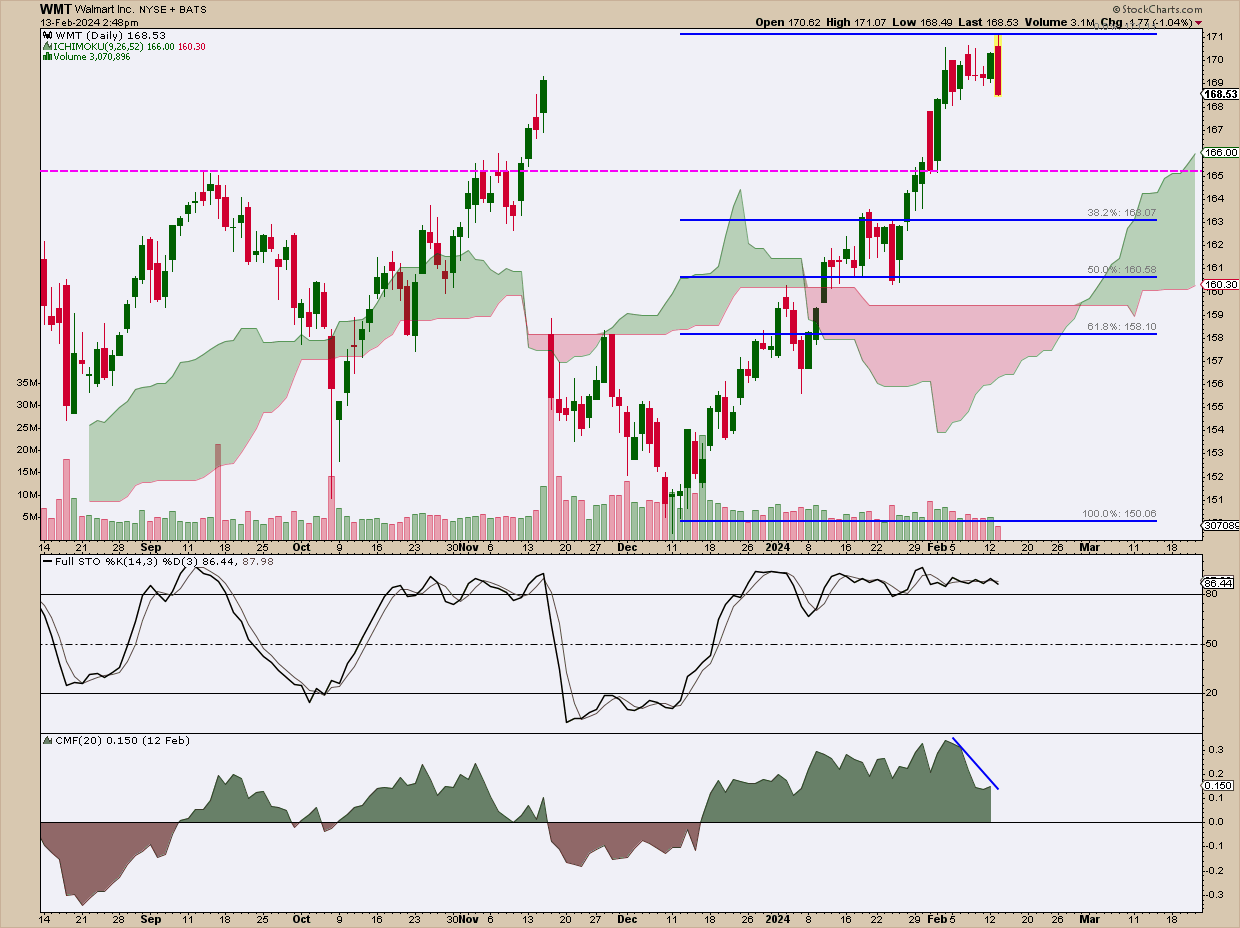
CHART 2. DAILY CHART OF WALMART. Layering various indicators to find a confluence of support, establishing a range rather than specific levels, can be helpful when looking for a tricky entry.Chart source: StockCharts.com. For educational purposes.
After hitting an all-time high Tuesday morning, Walmart’s stock price succumbed to market forces, falling below yesterday’s open, signaling the beginning of a pullback.
Looking at the Stochastic Oscillator, Walmart stock has been hovering in overbought territory since the end of December. But it wasn’t until early February that buying pressure began to recede, as shown in the Chaikin Money Flow indicator, but not to the point where the CMF crossed below the zero line.
Here’s one game plan if you’re bullish on WMT:

- Set a price alert at around $165.25, near a set of resistance levels that have been tested twice, yet may be too high to consider as reliable support.
- Once Walmart’s stock price reaches and hopefully breaches this level, look for early buyers to begin jumping in at $163, coinciding with the 38.2% Fibonacci retracement line.
- Note that an Ichimoku cloud has also been plotted to suggest a wider support range (versus specific support levels).
- The ideal entry spot (not signal) is between $158 and $160.75, near the Ichimoku cloud’s lowest level, Leading Span B.
- A favorable entry signal would be a candle or sequence of candles reversing upward on strong momentum and high volume.
The Bottom Line
So, what are we getting at? In the midst of a significant CPI-driven downturn tanking all three US indices, Walmart Inc. (WMT) was one of 37 notable outliers, with its stock price rising before succumbing to the market trend. The StockCharts’ scan engine identified WMT in the predefined New All-Time Highs scan. There are many reasons to feel bullish about Walmart stock, but finding a favorable entry point takes a little nuancing. Hopefully, the layering of the indicators above can help you map out a basic entry strategy, particularly if you’re bullish on WMT or looking to get in before or after its coming 3-for-1 split.
Disclaimer: This blog is for educational purposes only and should not be construed as financial advice. The ideas and strategies should never be used without first assessing your own personal and financial situation, or without consulting a financial professional.