

Eli Lilly’s Volatile Victory: What Tuesday’s Turnaround Means for Your Portfolio

After topping Wall Street’s earnings and revenue expectations on Tuesday, Eli Lilly & Co (LLY) shot up 5% from the prior day’s close, only to see its gains evaporate mid-day.
A double hit that had some investors stunned, is it time to “overweight” the company whose rock star prospects rest on two of its most popular drugs, Zepbound ™ (for weight loss) and Mounjaro ™ (for type 2 diabetes)?
Eli Lilly’s full 2024 guidance is right around Wall Street consensus, but it also forecasts that demand for a number of its drugs will outpace supply. So, despite its Tuesday gyrations, is LLY—which soared to an all-time high—a stock to buy now?
Eli Lilly Stock: Rising Star, Shooting Star
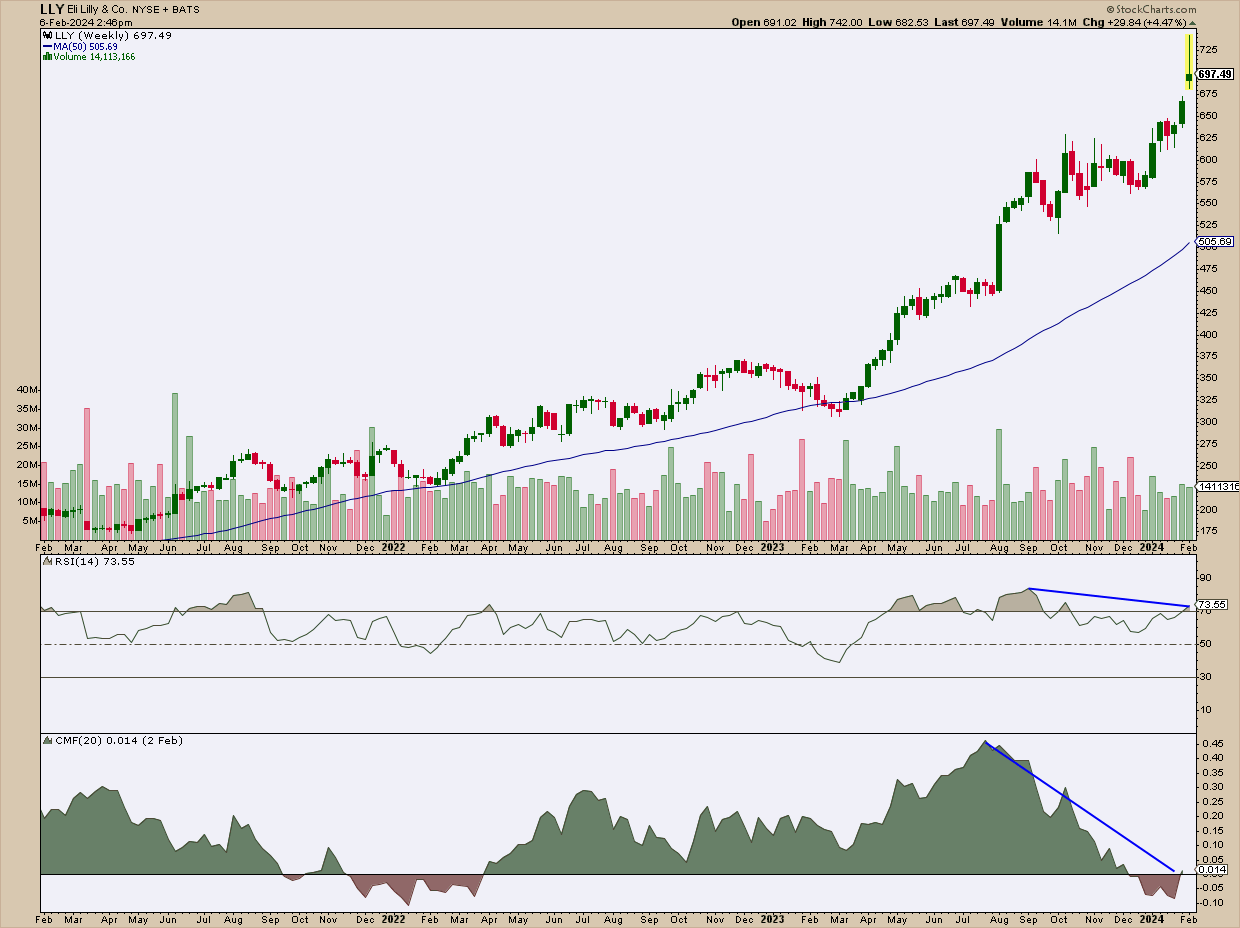
CHART 1. WEEKLY CHART OF ELI LILLY STOCK PRICE. The big-picture technicals can sometimes serve as an early warning system not apparent in fundamental data.Chart source: StockCharts.com. For educational purposes.
Here’s where fundamentals, which is largely bullish, and technicals, which show hints of skepticism, come to a head. Despite strong earnings and guidance, it’s hard not to notice the following:
- A shooting star candlestick pattern, which hints at a bearish reversal; look at that strong price rejection from the high!
- Last week’s price gap, which, according to Thomas Bulkowski’s Encyclopedia of Chart Patterns, has a 60% chance of getting filled if it’s an exhaustion gap versus an 8% chance of getting filled if it’s a runaway gap (of a larger trend that has yet to materialize).
- The Relative Strength Index (RSI) and Chaikin Money Flow (CMF) hint at a bearish price divergence, the CMF much more pronounced than the former based on the selling pressure below the zero line.
This is a tough reading because LLY’s fundamental prospects are mostly sunshine, with no shadows in sight, while the technicals are pretty much all shadows.
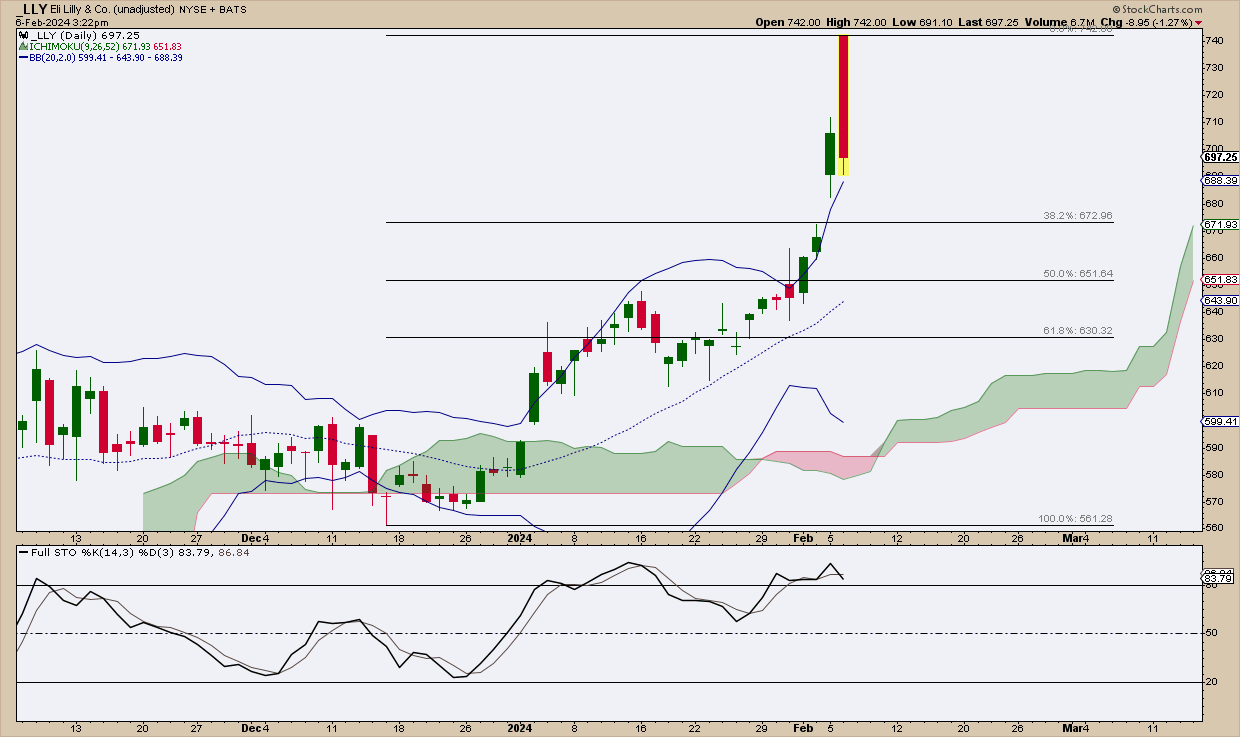
CHART 2. DAILY CHART OF ELI LILLY STOCK PRICE. There are multiple potential support levels and entry points. Layering several indicators can reveal a confluence of levels/ranges, which gives you a better chance of identifying critical entry levels.Chart source: StockCharts.com. For educational purposes.
The following are a few things to consider:
- The stochastic oscillator is well within “overbought” territory, signaling that prices are a bit overvalued at its current level.
- Price is well above the upper Bollinger Band®; not only does 85% of price action happen within the upper and lower band, but price tends to revert to or near the middle band, even after a strong move (though it can remain above or below the middle band for an extended time).
- The Ichimoku Cloud has been plotted for reference; the trend is bullish, but its support level is well below a few other critical levels, which may provide buying opportunities.
You can use the Fibonacci Retracement levels as a guide:
- The 32.8% retracement sits right below last week’s price gap; it’s likely to get filled, and if you’re looking to scale in a long position, it would be the highest (and earliest) level to go long. You might set a price alert at $680, above this potential entry point.
- The area between the 50% and 61.8% retracement ($650 and $630, respectively) is where the middle Bollinger band is located. This is probably your most favorable entry point for the bulk of your long position.
- If price trades below $615, the most recent swing low and a level that’s been (bullishly) rejected three times last month, then the current bullish thesis has to be re-evaluated; not that it’s gone entirely, but the context and timing of the trade would have to be redrawn.
Set a Technical Price Alert
Setting a technical alert at these support and resistance levels would be helpful as you weigh your potential entry points against any market developments that may influence your decision.
To access the Technical Alert Workbench, follow these steps:
- Log in to your StockCharts account.
- At the top of any page, click on Your Dashboard.
- Click the Alerts or the New button in the Your Alerts panel.
- Choose which type of alert you want to create from the Alert Type buttons at the top left. To create a price alert, select Price Alert as the alert type.
- Add LLY in the symbol box and set your price trigger.
- Choose how you wish to be notified, then click the Save Alert button.
The Bottom Line
LLY popped up in a StockCharts New All-Time High scan. The stock showcased a volatile turn after beating Wall Street’s forecasts, pitting its strong fundamental outlook against the technical picture suggesting caution. Technical patterns like the (weekly) shooting star candlestick, bearish divergence, and the “overbought” conditions seen on the daily chart all signal an imminent pullback. Despite these bearish hints, strategic entry points identified through Fibonacci retracement levels could offer investors a balanced approach to leveraging Eli Lilly’s fundamental strengths while navigating technical uncertainties.
Disclaimer: This blog is for educational purposes only and should not be construed as financial advice. The ideas and strategies should never be used without first assessing your own personal and financial situation, or without consulting a financial professional.